Customizable reports
Start from a template or choose the metric, chart, segment and filters yourself.
Clienta CRM reporting & insights
Sales reports that keep you in the know.
Your CRM already holds the data that grows the business: deals, values, stages, activities and owners. Until that data becomes a readable report, sales meetings run on guesses and competing spreadsheets.
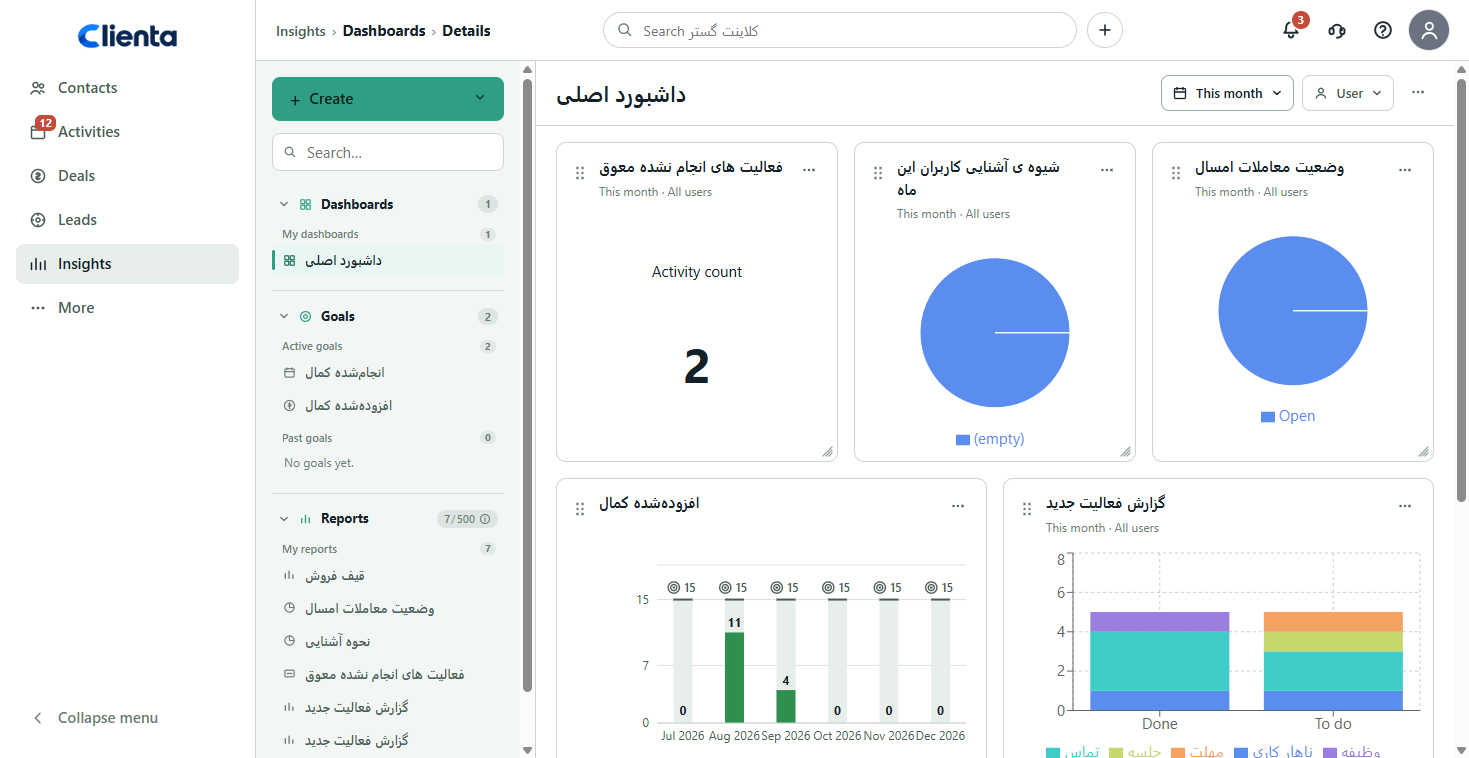
Clienta Insights turns current records into reports, dashboards and goals. See what you sold this month, who is behind target and where the funnel slows down — without building a parallel Excel process.
What is CRM sales reporting?
A month-end spreadsheet only explains what already happened. CRM reporting matters when you can follow revenue, conversion and follow-up during the month, spot variance from target and act the same day.
Clienta reporting & insights features
Start from a template or choose the metric, chart, segment and filters yourself.
Arrange reports and goals for each role, then filter by period or user.
Set deal or activity goals by owner, period and amount, and watch progress week by week.
See recorded revenue, potential sales and the gap to target together.
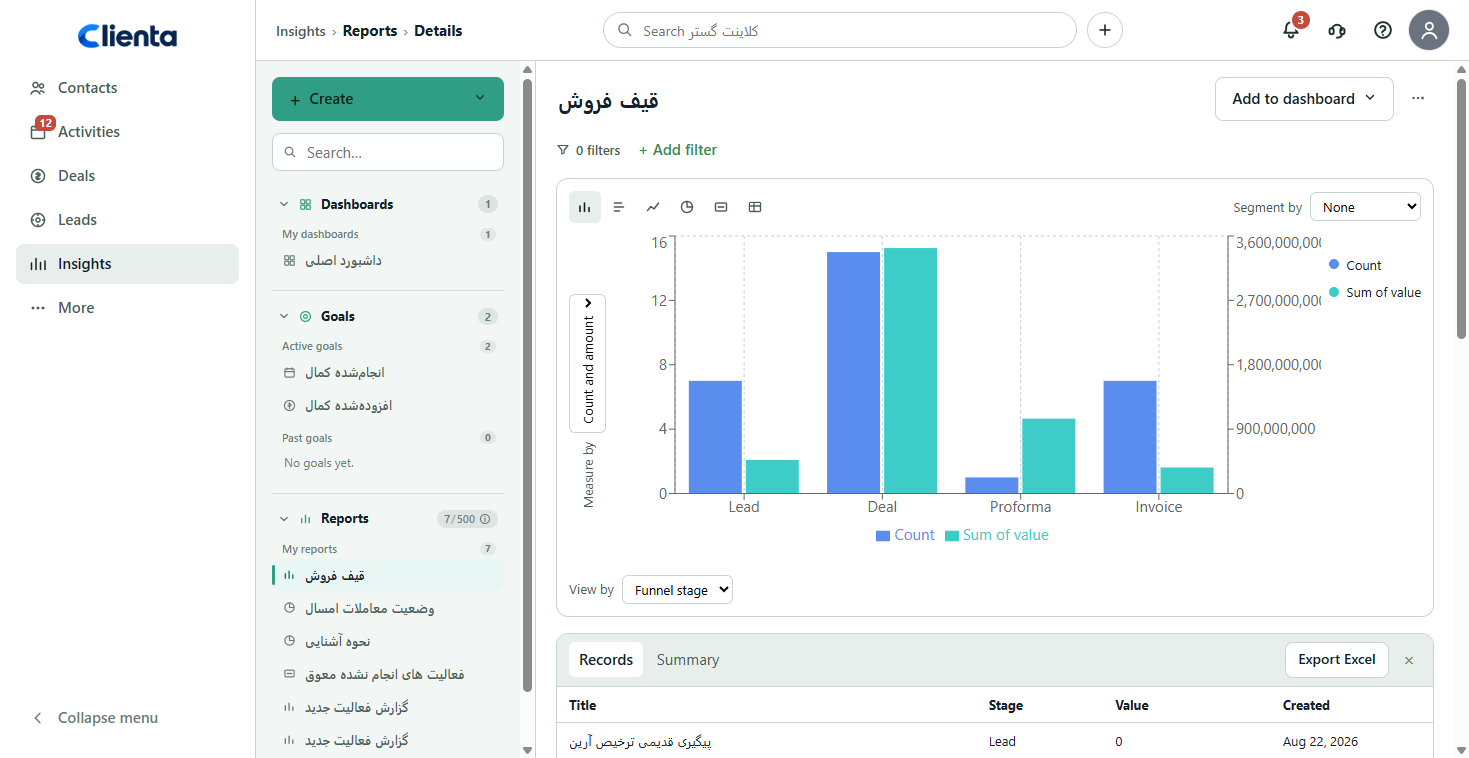
Read seller conversion, funnel stages and lost reasons from the same deal data.
Compare completed work, overdue tasks and workload with the sales result.
What to look for in sales reporting software
If reporting is not built from current data, does not open the records behind a number and cannot sit next to a team goal, the dashboard becomes a status poster.
Reports should come from deals, activities and enabled financial records — not a second round of spreadsheet entry.
Templates get you started; custom metrics and filters answer the question your team actually has.
Vague targets cannot be tracked. Owner, period, type of work and amount need to be explicit.
Potential sales only mean something when deal value, stage and expected date stay current.
A CEO or partner should not need several files to see the revenue trend.
Software feature
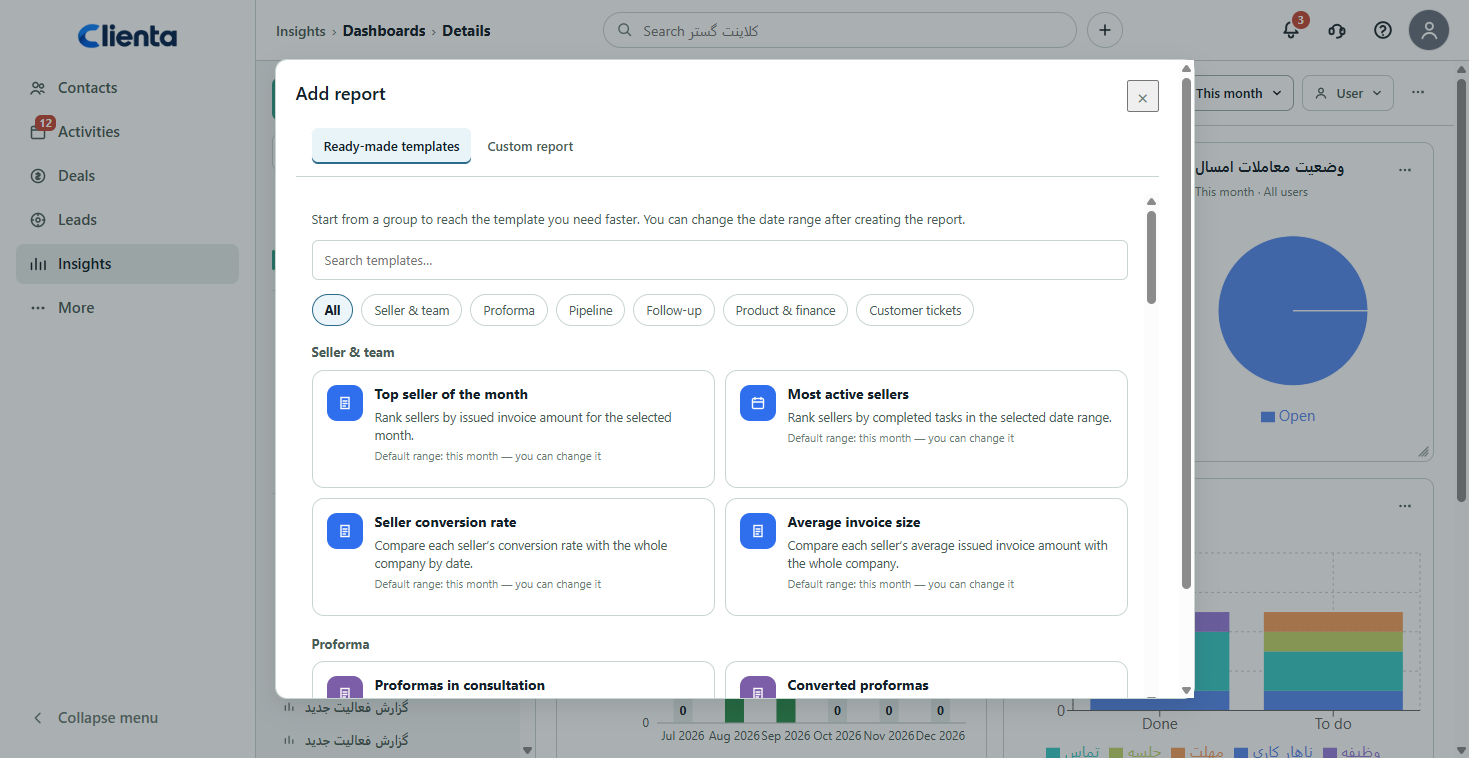
Every business needs different metrics. Building reports by hand is slow, and the wrong field produces the wrong answer. In Clienta you start from templates such as sales funnel, top seller, conversion rate and overdue tasks, then change the metric, chart and filters.
Software feature
Static spreadsheets and charts detached from daily work are not enough. Clienta dashboards collect reports and goals in one view so managers can see performance, find bottlenecks and react the same day.
From question to decision
Data captured in daily work flows into reports. You pick the question, shape the chart and bring the same number into the meeting.
Leads, deals, values, stages, owners and activities — plus quotes and invoices when those tools are on — enter the team workflow.
Start from funnel, conversion or top seller, or set the metric, chart and filters yourself.
Arrange widgets for a meeting or role, then filter by this month, this quarter or a specific user.
Inspect the records, export the report or, on eligible plans, share the dashboard.
Software feature
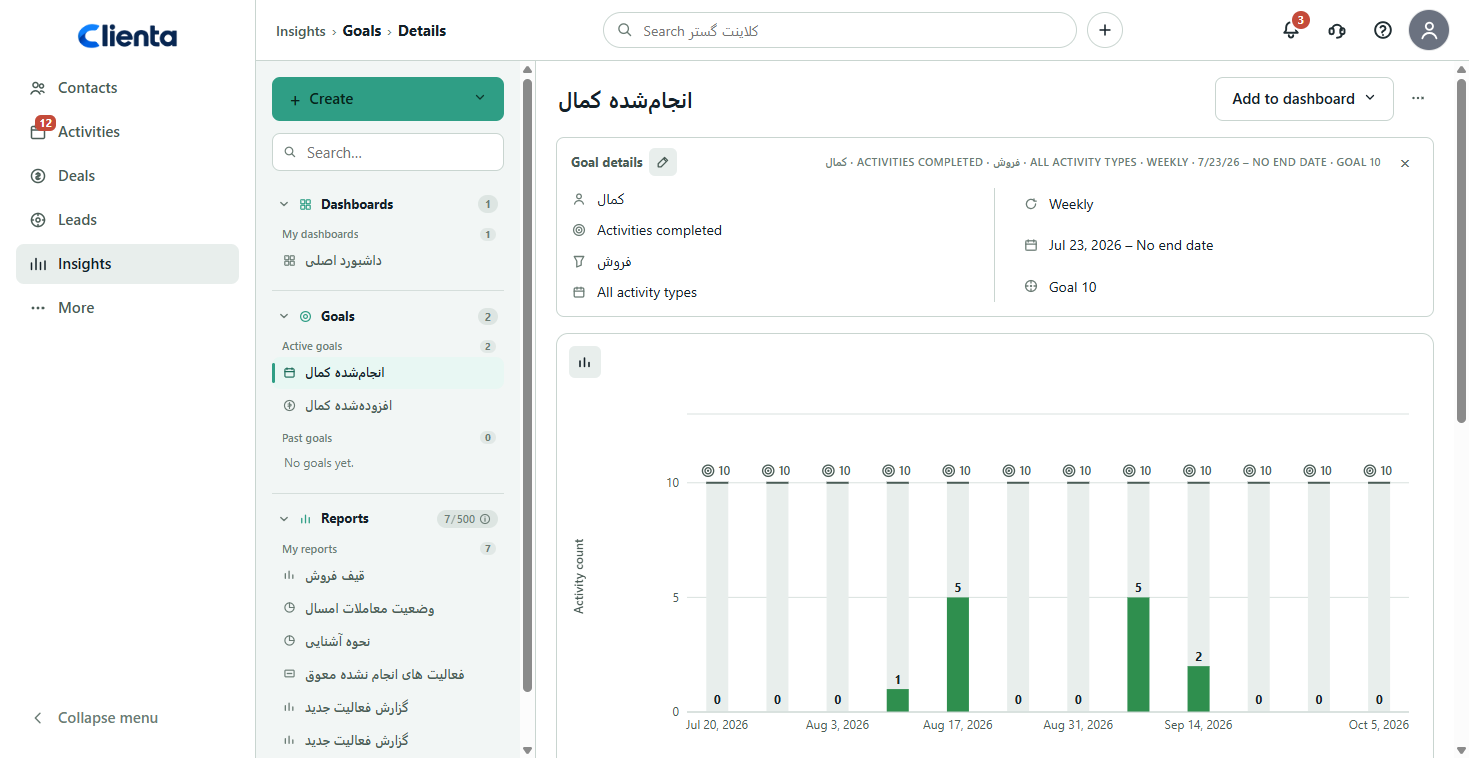
Vague goals are hard to track. In Clienta you attach a goal to deals or activities, set the owner, period and amount, and see weekly progress against the real work of the team.
Software feature
Forecasts get more reliable when deal value, stage and expected date stay current. Funnel and conversion reports show which stages are crowded and where the path from lead to invoice leaks.
One dataset, three decision views
How are revenue and conversion changing, who is behind target and how is follow-up progressing?
How far am I from target, what is overdue and which deal needs attention today?
What are the revenue and potential-sales trends, and are they aligned with the business plan?
Frequently asked questions
A report is actionable when it is built from current CRM data and still opens the records behind the number. In Clienta you shape reports and dashboards around a specific question — what we sold this month, who is behind target — and drill into the deal or activity from the same view.
Pick the right metric and filter: revenue, deal count, conversion, source or team activity. Then segment by seller, stage, period or lost reason so you can see where growth or decline is coming from.
CRM reporting uses current customers, deals and activities, so duplicate entry and file merging drop, and you can decide during the month instead of only at month end.
There are three parts: reports, dashboards and goals. Reports visualize performance, dashboards collect reports and goals for each role, and goals add the plan on top of the same data.
Yes. Plans with this capability let you create dashboards, arrange report and goal widgets, resize them and filter by period or user.
Templates include sales funnel, top seller, seller conversion, stalled deals, lost reasons, overdue tasks, revenue forecasting and average invoice size. Exact availability depends on the active plan.
Start free for 14 days, add a few real deals and activities, and test the dashboard against your team’s real questions.